
During building operations most property owners rely on outdated, inaccurate data of their property. The longer the life cycle the higher the risk of losing track of the changes. Is it any better for new buildings? The truth is that most of the new buildings are delivered only with the original design plans that are already obsolete at the time of the delivery. This inital data gap versus the as-built status is further increasing over time dooming smart decision making and optimized building uitilization.
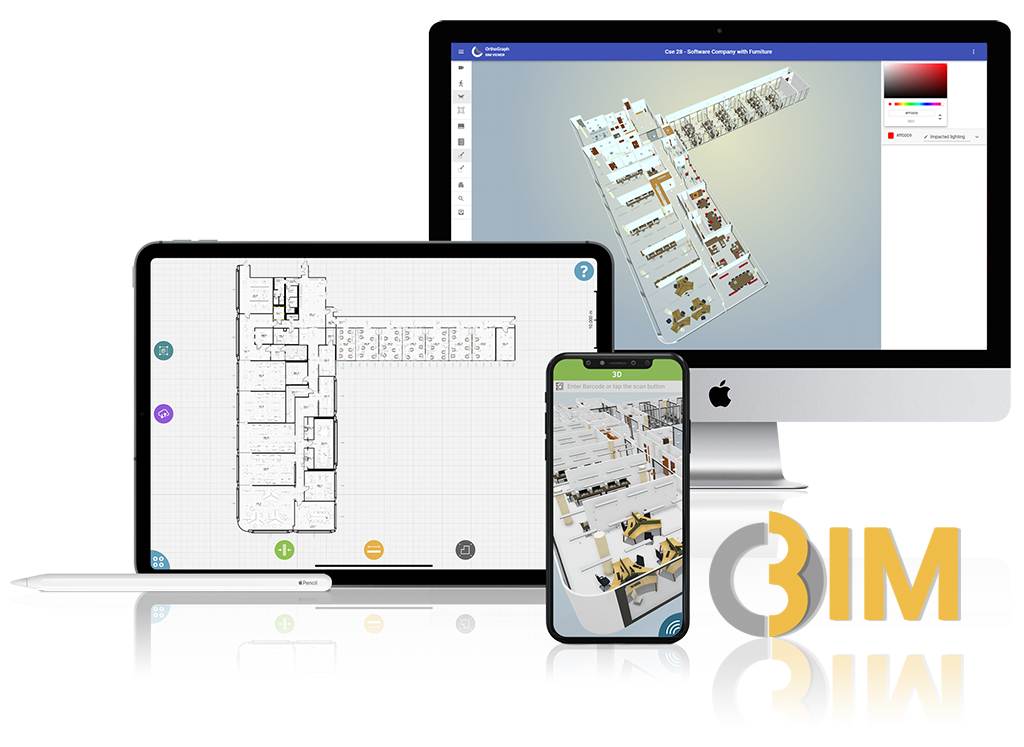
How to close the gap, how to avoid using obsolete, misleading building data? OrthoGraph's Operational BIM ecosystem provides you an accurate 2D/3D overview with asset inventory of any new or already existing property.
Is it only a one-shot survey? No. Our BIM models will never go obsolete. We give you a mobile and web based technology that ensures easy model updates throughout the complete life cycle.
Are your buildings operated at the highest possible performance? Are your costs and revenues calculated based on precise real life building data? Do you have any idea how much performance improvement potential you have left unexploited? Would you like to monetize this potential, see the expected ROI rates?
We help you to do the math. Fill in the editable fields with your building data in the below chart, set the savings rate you expect, print the data sheet and start brainstorming with your team. We are absolutely convinced that getting in full digital control of your real estate portfolio will reward you with significant savings and service improvement.
| Net area of buildings | m2 | Expected number of inventory items | pcs | Calculation currency: |
The following parameters were used as the basis for the return on investment calculations:
| Savings Item | Detailed Description of Savings Items | Affected Part of the Building Annually |
Expected Savings |
Unit Price | Annual Savings |
|---|---|---|---|---|---|
| Detailed condition survey to reduce renovation and refurbishment costs | Renovate only what really needs renovation, pay only for the job that was really done. Rely on precise surface figures broken down into material groups.  When creating the graphical inventory prior to the renovation, each element of the BIM model can be tagged with its condition. This way you can save significant cost (demolition, waste handling, new item purchasing, human labour) on items in good condition. The other immediate benefit is that OrthoGraph's Excel output provides you the necessary data for fast and efficient tendering. OrthoGraph can be used for rapid measurements to follow up the project implementation phases and to document the final result for the long term operation. These measurements will ensure full cost control over your contractors' work. When creating the graphical inventory prior to the renovation, each element of the BIM model can be tagged with its condition. This way you can save significant cost (demolition, waste handling, new item purchasing, human labour) on items in good condition. The other immediate benefit is that OrthoGraph's Excel output provides you the necessary data for fast and efficient tendering. OrthoGraph can be used for rapid measurements to follow up the project implementation phases and to document the final result for the long term operation. These measurements will ensure full cost control over your contractors' work. |
% | % | €/m2 | 1 234 567 € |
| Better property utilization, improved service level and cost allocation | Maximize building performance by data driven tenant and space management. The colorized graphical reports will improve your decision making. What's my performance rate (usable area / service area)? How should I rearrange the available spaces to maximize occupancy? The BIM models will enable you to find the answers yourself. Meet your tenants' expectations the most and any performance improvement of the building will result in instant revenue generation. Remember, the only limit is the external walls. OrthoGraph performs best when integrated with other smart systems (IWMS, BMS, ERP etc.) Using the colorized floor plans functionality you will be able to highlight live data feed (colours, text or alphanumeric data) coming from your external sources in the 2D/3D models. |
% | % | €/m2/month | 1 234 567 € |
| Rental surfaces properly calculated in line with their real use | Stop loosing money due to inaccurate floorplans. Renegotiate rental contracts by using precise surface figures. In our experience the inaccuracy of known rentable area can go up to 5-10% compared to reality. Once your spaces are digitized to BIM you will benefit of OrthoGraph's accurate Excel reports. Review your contracts to maximize your rental revenue. This will result in a continuous increase in rents. |
% | % | €/m2/month | 1 234 567 € |
| More efficient maintenance, less downtimes, centralized knowledge of assets data, service provider contract optimiztaion | Find the right maintenance points with 3D digital support, repair the right equipment with the right tools. All changes recorded on site, where and when they happen. Renegotiate service contracts and SLA's (cleaning, security, etc.) by using precise surface figures. How to achieve 10% saving on maintanance material cost and further 20-30% on labour cost? Document your critical equipment in the Operational BIM. Finding the right maintenance point, detecting the problem and fixing it often requires a few comebacks. Your maintenance personnel will be the happiest people if they can solve everything in one go. Before going to the site they can check the previously registered photos, maintenance videos to select the proper tools and replacement parts. They will use the 3D models to navigate to the right element and scan the barcode/RFID to avoid any last mistake. All building changes are recorded in the centralized Digital Twin database, not in the heads of the maintenance crew. In our experience the inaccuracy of known rentable area can go up to 5-10% compared to reality. Once your spaces are digitized to BIM you will benefit of OrthoGraph's reporting functionality. The cleaning area report for example will give you the net surface figures that are truly subject to cleaning. Review your service contracts to minimize your service provider costs. |
% | % | €/m2/month | 1 234 567 € |
| Continuous follow-up instead of re-surveying and re-inventoring every 3-5 years | Keep good record of the building's evolution (floorplans, inventory, equipment, moves, etc.) in the Digital Twin and you will avoid the heavy cost of periodic re-surveying. Do you have a regular inventory update obligation? Replace the recurring high cost snapshot by the continuous Operational BIM follow up as part of the daily maintenance worflows. Storing the building information in a central Digital Twin depository will hihgly increase your independence from your employees and subcontractors. Get in control, stay in control. |
% | 1 234 567 € |
Hey OrthoGraph, how long does it take to have my Return on Investment? How much is my ROI % in 6 months, one year, etc? You have understood by now that it depends on several parameters. However, the below chart will already give you a fair enough indication. For the calculation methodology please find further details below the chart. Come on, let's see your savings finally!
How long does it take to have my Return on Investment? How much is my ROI % in 6 months, one year, etc? You have understood by now that it depends on several parameters. However, the below chart will already give you a fair enough indication. For the calculation methodology please find further details below the chart. Come on, let's see your savings finally!
| Result | Amount |
|---|---|
| Total expected annual savings | 0 €/year |
| Total expected time of survey and inventory services | 0 weeks |
| Expected total cost of ownership for the first year | 0 € |
| Expected total cost of ownership for the following years | 0 €/year |
| Expected ROI in the first year | 0-times |
| Expected ROI in the following years | 0-times annually |
What services OrthoGraph will provide me exactly? Here you have the service list behind the above calculations. We assume a full-fledged project including the survey, the technical setup and running the Operational BIM ecosystem on the long term:
- As-built survey and BIM modeling fees for the given area
- Graphical asset inventory using unique RFID or barcode identifiers on each individual item
- All software license costs for unlimited number of maintenance crew and decision makers
- One typical integration with an IWMS or BMS system
- All cloud software hosting fees
- System configuration fees, template creation for the surveying services
- Training costs
- Required hardware to run the Digital Twin and maintain its content
OrthoGraph can already produce these ROI numbers as a standalone solution using its Excel and IFC/DXF outputs without deep integrations with external systems. This way we recommend you to try it via a pilot project on a selected building. Please contact us to prepare you a customized price offer either for a pilot project or to cover your full building portfolio.
To get these results of your calculation and also to see the estimated total project cost please click the I'm interested button and we will send the results to you via email.